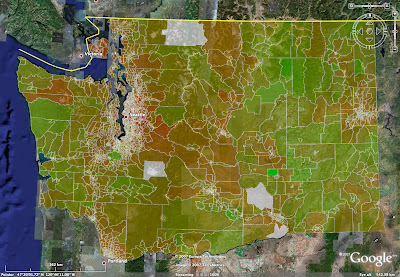
Using the new functionality I've discussed in the last two posts, I am pushing forward in creating new maps. Today I'm going to share a few maps of median household value (variable H76 - MEDIAN VALUE (DOLLARS) FOR SPECIFIED OWNER-OCCUPIED HOUSING UNITS [1] from Summary File 3). There is another variable, H85, which might be better for what I want, but I'm going to go ahead and share these maps before going back. These new maps show the median household value by block group for Washington state. There are ~4,300 block groups in Washington and a wide array of values in the data, so this data provides a good test of the new functionality (labels, excluded polygons, logarithmic color scales). Given the large number of block groups, I've found that it takes several different map formats to fully explore the data. I've created maps that have the 3D views I've shared before and maps that are flat with some transparency so that you can see the underlying geography.
One of the challenges I found in creating these maps was gathering the Census data at the block group for the entire state. NHGIS doesn't provide many variables beyond the basic population and economic ones and the Census FactFinder website doesn't make it easy to download all of the block groups for a given state at once - you have to download each county separately. Given these challenges, I looked into download the raw data from Summary File 3. There raw files are available by FTP but, of course, are in a very complex format. The Census Bureau provides an Access database template that contains empty versions of each of the ~80 tables needed to work with the data (including import specs which is quite helpful). Feeling intrepid I downloaded all of the data for Washington state (FTP site) and loaded the tables I needed to into the Access template. This worked pretty well, but is somewhat confusing, particularly because joining the geographic identifiers for each record is not quite as straight forward as the Census documentation would lead you to believe. I finally got it to work and this provided the data for the maps provided below - perhaps you can now understand why I haven't gone back and re-run the maps using the H85 variable yet.
In the maps below, the more red an area/shape, the higher the median household value - the greener, the lower the median household value. In the 3D maps, each $1,000 of value adds one meter of height. You'll note that some areas show up as white, this is because the data provided by the Census for these block groups is 0. This makes sense for places like Mt. Rainier, but not for a region of downtown Seattle that shows up as white. I'm going to look into this next.
Now, some maps (don't forget you can click on each picture to get a larger version)!
Entire state (flat from overhead):
Entire state (flat from overhead, borders around each block group, some transparency):
Entire state (3D from overhead): 
Entire State (3D looking North):
Entire State (3D looking East):
Seattle (3D looking Southeast):
Seattle (flat from overhead, borders around each block group, some transparency):
Friday, April 6, 2007
Median Household Value for Washington state by Block Group
Posted by
aidan
at
10:59 AM
![]()
Labels: data, maps, screenshot
Subscribe to:
Post Comments (Atom)
No comments:
Post a Comment