I am stretching my wings beyond Census data - and what could be more interesting then campaign contribution data? I have an interest in politics and thought it would be fascinating to see if there were ways to make the data about the amount spent on elections available. Using the same basic framework I created to read in Census data, I decided that the Federal Election Commission (FEC) would be a good source of interesting data about elections.
The Census provides boundary files for the last eight Congresses. The FEC provides a wealth of data and I have just started to explore the full extent of what is possible. I started by using the Candidate Financial Summary Without PAC Breakdown data. This data, of course, is in a rather complex format, so writing a Ruby module to read it out was the first order of business.
The Census boundary files for the 110th and 109th are in a relatively similar format (the 108th and before begin to deviate substantially) so I used these as my polygon files. I used the Candidate Financial Summary Without PAC Breakdown (CFS) files from the FEC. These files are the most current but do have some potential accounting issues. As the FEC states:
The cost of this timelines, though, is that some of the information available here is less precise than for "cansum". For example, in "cansum" you can see how much a campaign received from Corporate PACs or Labor PACs, while here there is only one value for the total received from "other political committees." This includes all PAC contributions, but it may also contain contributions from other candidates, and some other types of committees we don't typically think of as PACs. We can't do the full breakdowns until all the information about specific contributions has been entered into the database.
When using these summary files you need to be aware of some possible double counting of activity. Some candidates have more then one committee authorized to raise and spend funds on their behalf. The activity reflected in this file represents the sum of those committees. If they transfer funds back and forth among each other, this activity would be counted twice. Information about "transfers from authorized committees" and "transfers to authorized committees" is included in the file and if there are values in both of these fields it is necessary to subtract these from total receipts and total disbursements to obtain a more accurate value for actual activity.
In creating a data structure to store the CFS data, I created a somewhat flexible way to aggregate the data using some of the interesting features of Ruby. In particular the
eval statement make it quite easy to pass in free text to allow the caller of the aggregation function to specify which field to aggregate quite easily. I encountered two main challenges mapping the CFS data back to the Census Congressional District polygons. First, the FEC uses the two-letter acronym to identify the state and the Census uses FIPS codes to identify states. Using regular expressions in TextMate, I converted the list from the Census website to a couple of different Ruby hash tables so that I could convert back and forth from two-letter acronym to two-digit code.
Second, the FEC files are somewhat inconsistent (at least based on how I am reading it) about how they handle states with only one Congressional District. The Census bureau is pretty clear that it uses "00" to identify districts that are the sole district for a given state. The FEC seems to follow this convention for the most part, except in a couple of states. For example, in Wyoming there are candidates for the House of Representatives listed in Congressional Districts "00" and "01". Wyoming has only one seat in the 110th congress. Here is a snippet from the webl06.zip file which contains the CFS data for the 2005-2006 election cycle (the ellipses represent where I have cut from the line for the sake of readability):
  H4WY00055CUBIN, BARBARA L                      I2REP...WY01 W W48...
  H6WY01025TRAUNER, GARY S                        1DEM...WY01 W L47...
  H6WY00118WINNEY, JUSTIN WILLIAM JR              2REP...WY00     0...
According to the documentation for the file, the two digits following the state acronym represent the district. In this case, it would appear to suggest that there are candidates for House in district "00" and "01", when in fact there is only one district in Wyoming. To handle this, I simply rolled up all of the House candidates, regardless of the district in the FEC file for one district states. This may be the wrong thing to do, so I've got an e-mail into the FEC to find out the actual answer.
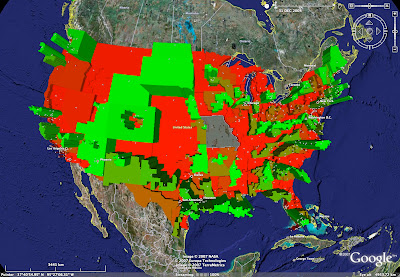
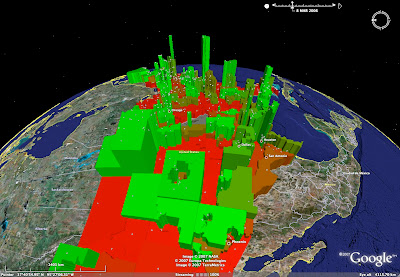
Alright, enough with that background, let's see some pictures. In the following screenshots, I am mapping the total amount received by House of Representative candidates in each Congressional District for a given election cycle. For each $1,000 received, the district gets one meter in height. The districts with higher amounts are more green, those with lower amounts are more red. Missouri is missing from the 109th Congress because the polygon metadata file is missing from the Census website.
109th Congress from above:

110th Congress from above:

109th looking North:

110th looking North:

109th looking West:

110th looking West:

109th looking East:

110th looking East:

109th looking South:

110th looking South:

That is it for now. I'm close to sharing the KMZs for these, so be on the look out for a post soon.
No comments:
Post a Comment